- Spreadsheet docs
- Start here
Examples
Sample workbooks that open in 8sheets with one click, each showing a group of features.
Each example is a real .xlsx file. The link opens it in the 8sheets app, in your browser: nothing is installed and nothing you change is sent anywhere. Save a copy with File > Save As to keep your changes, or open the same file in Excel to compare.
Getting started
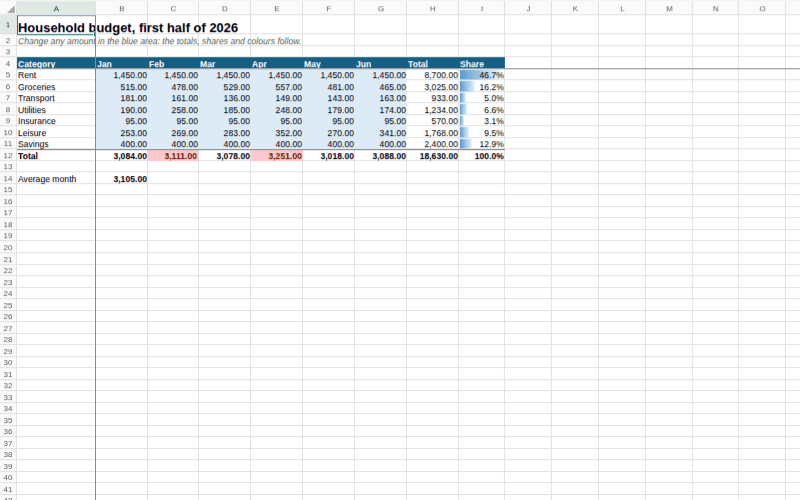
A household budget for six months. Change any amount in the blue area and the totals, the shares and the data bars follow. Months above the average spend turn red through a conditional formatting rule. The header row and the first column are frozen.
Formulas
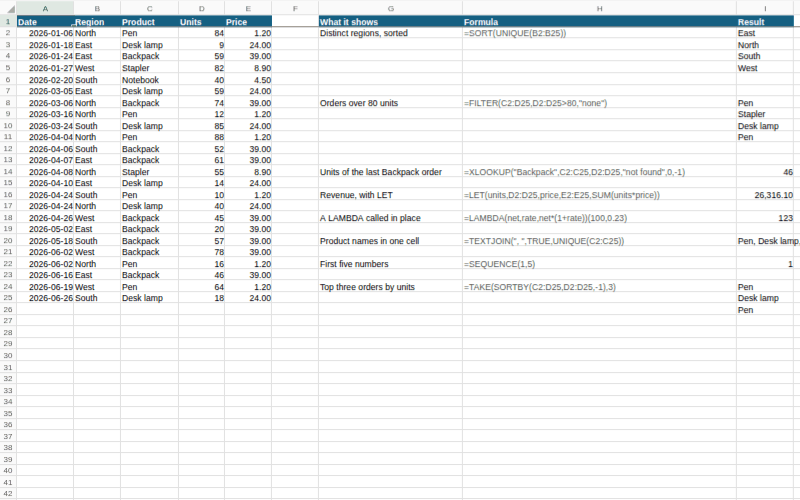
A list of orders with the newer functions next to it, each with its formula written out: SORT and UNIQUE, FILTER, XLOOKUP searching from the end, LET, a LAMBDA called in place, TEXTJOIN, SEQUENCE and TAKE with SORTBY. The results spill into the cells below and to the right. Edit an order and watch them change.
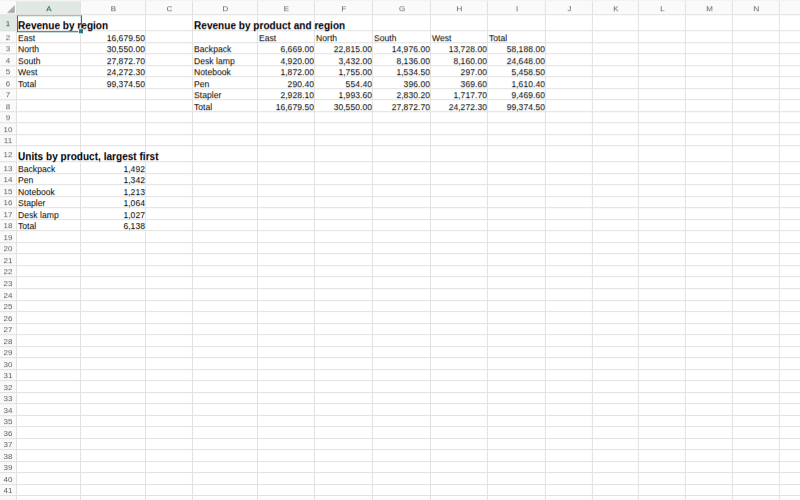
120 sales rows on the Data sheet, summarised on Summary by GROUPBY and PIVOTBY formulas: revenue by region, revenue by product and region, and units by product, largest first.
Data tools
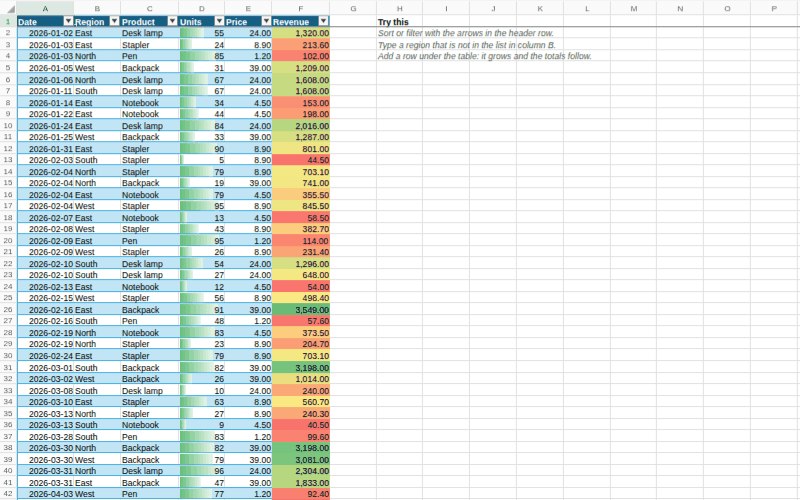
A table named Sales with a calculated column (=[@Units]*[@Price]) and a totals row. Region is a dropdown list and units must be a whole number from 1 to 1000; try typing something else. Data bars show units and a three-colour scale shows revenue. Sort and filter with the arrows in the header row.
Charts
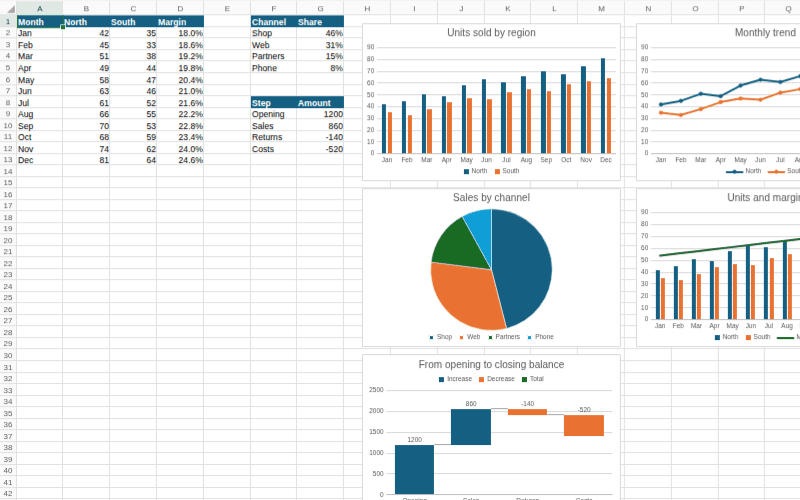
Monthly figures drawn as a clustered column chart, a line chart with markers, a pie, a combo chart with the margin on a secondary axis, and a waterfall. Click a chart to format it, or change a number and see it redraw.
Dashboards
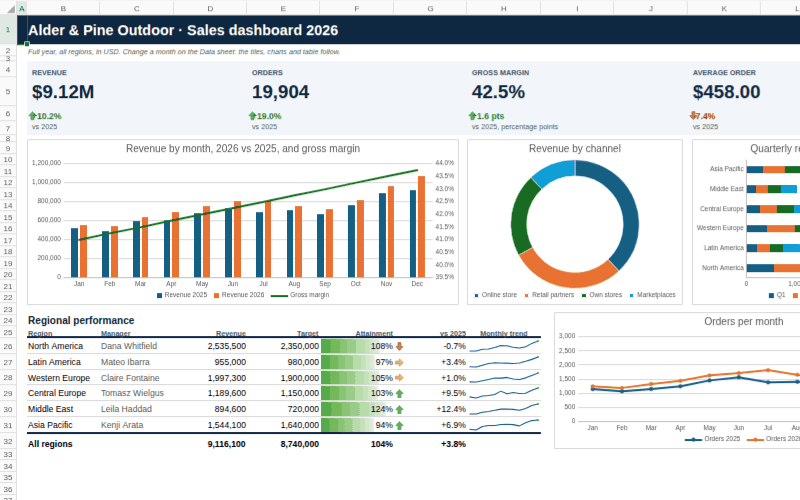
A one-page sales dashboard for a made-up outdoor brand, built the way a finance team would build one. Four KPI tiles show revenue, orders, gross margin and average order value, each with its change against last year and an up, sideways or down arrow from an icon set. Below them are a combo chart with the margin on a secondary axis, a doughnut, a stacked bar chart by quarter and a line chart with markers. The regional table has a data bar for attainment against target, arrows for growth and a sparkline of the twelve months in every row. The sheet has no gridlines, so it reads as a report.
Everything comes from the Data sheet: change a region's month there and the tiles, charts, table and sparklines follow. The Orders sheet holds 400 orders in a table with a totals row and three slicers; click a region, channel or category to filter the table.
Financial models
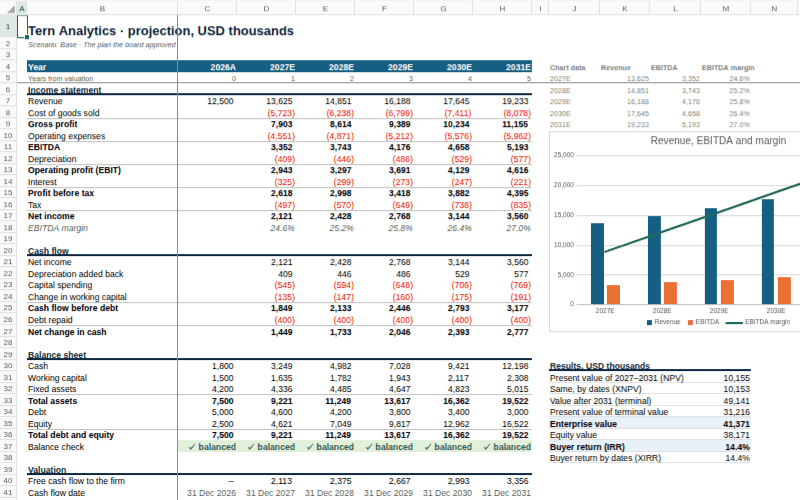
A five-year plan for a made-up software company, linked from inputs to valuation. The Inputs sheet holds three scenarios side by side; pick Base, Upside or Downside from the dropdown in C4 and an XLOOKUP feeds the live column, which every driver reads by name (Growth, GrossMargin, DiscountRate and so on). The Model sheet runs an income statement, a cash flow and a balance sheet whose check row stays balanced in every scenario. Revenue grows through GROWN, a LAMBDA saved in the Name Manager, and tax uses LET. The results compare NPV with XNPV and IRR with XIRR on real year-end dates.
Negative amounts turn red through conditional formatting and the chart redraws as you switch scenarios. Try a higher discount rate or a growth rate below zero in the Base column, and watch the valuation move while the balance check stays balanced.
Project plans
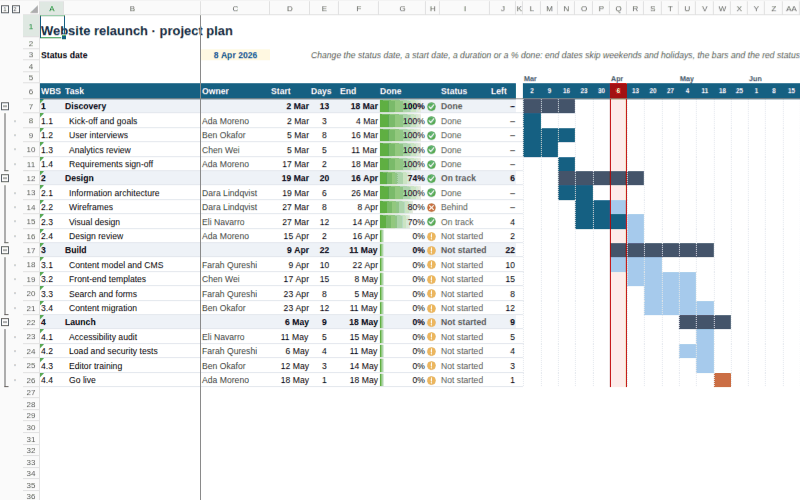
A website relaunch planned as a Gantt chart, with no chart object at all: the bars are conditional formatting rules on a weekly grid. Each task's end date is WORKDAY from its start and length, skipping weekends and the holidays listed on the Team sheet, and most tasks start the workday after the one they wait for, so moving one task moves everything behind it. Phase rows add up their tasks with MIN, MAX, NETWORKDAYS and a weighted SUMPRODUCT.
Change the status date in C3 and the red status week moves, the status icons and the days left are worked out again, and tasks behind schedule get a red mark. The owner column is a dropdown fed by the team list. Use the 1 and 2 buttons at the top left, or the minus signs, to fold the plan down to its phases.
PivotTables
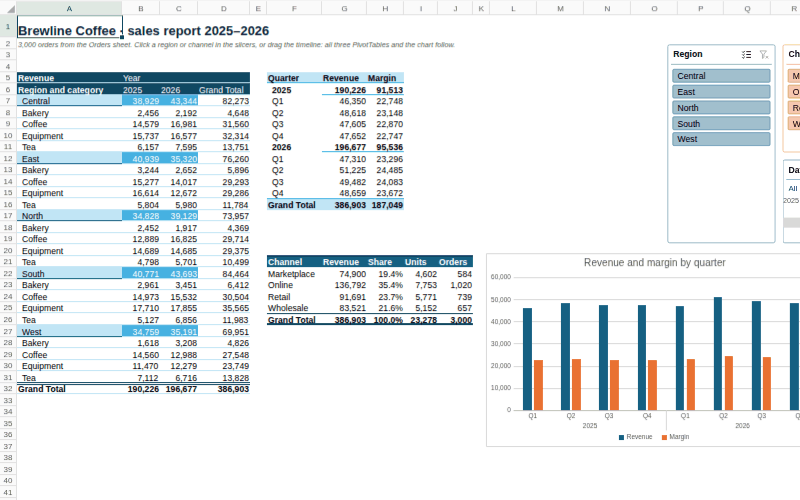
3,000 orders for a made-up coffee roaster on the Orders sheet, reported by three PivotTables on Report: revenue by region and category across the two years, revenue and margin by quarter, and the channel mix with each channel's share of the total, units and order count. A PivotChart draws the quarterly figures with two levels of labels.
The three slicers and the date timeline are connected to all three PivotTables: click a region or a channel, or drag across quarters on the timeline, and every table and the chart follow. Click a cell in a PivotTable to open its field list and move fields between rows, columns and values.
Print and PDF
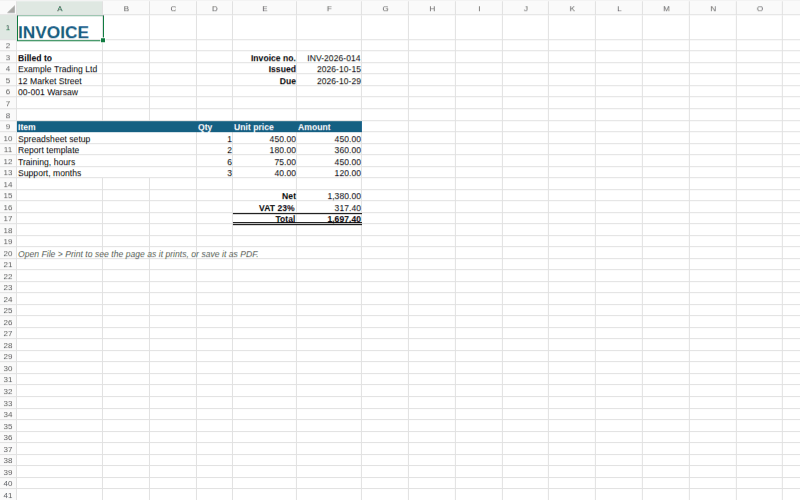
An invoice with merged cells, borders, number and date formats, and totals. Choose File > Print to see the pages and save them as a PDF.
Review
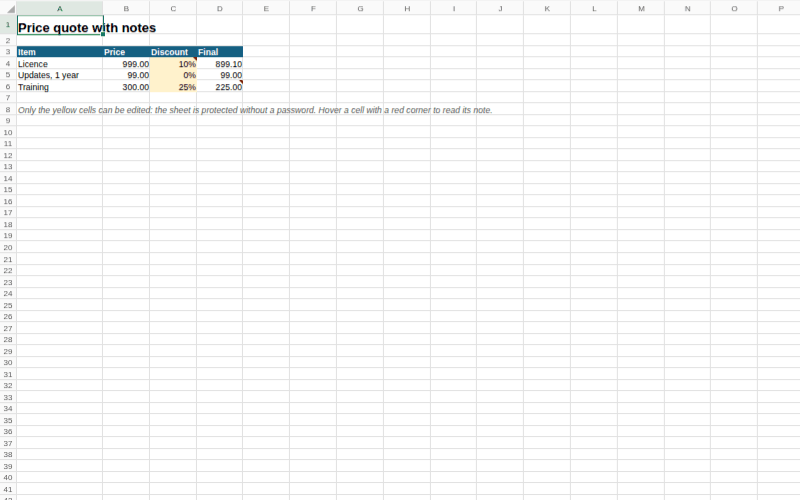
A price quote with notes on two cells and a protected sheet: only the yellow discount cells can be edited. Turn protection off under Review > Unprotect Sheet.
Big files
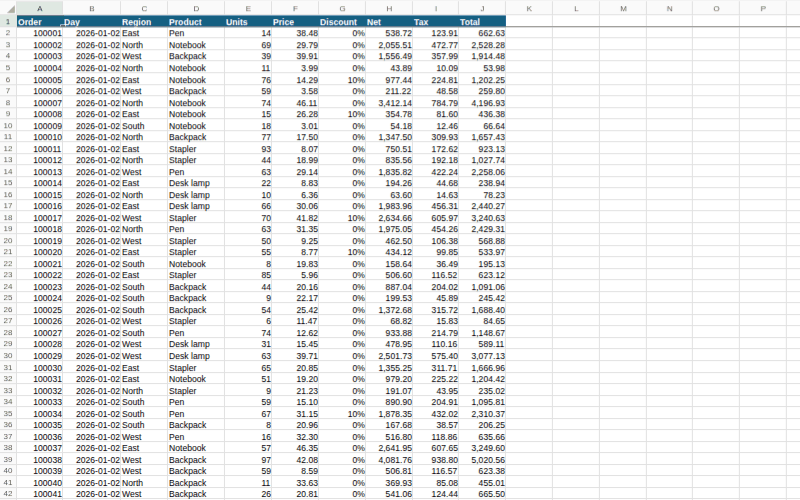
100,000 orders in 10 columns, three of them formulas: a million cells in about 7.5 MB, written through the API's bulk paths. The file is read as a stream in a background thread, so the first rows show while the rest loads and the page stays responsive. The status bar says how long it took.
Build your own
The samples are made by tools/gen-samples.mjs with the same JavaScript API you would use: createWorkbook, range.values, range.formulas, range.style, addTable, addValidation, addConditionalFormat, names.set and saveXlsx. The samples with charts, slicers and PivotTables (charts, dashboard, financial-model and pivot-report) are made in a browser page, tools/gen-sample-charts.html, because those need a mounted workbook; charts take their data from any sheet, as in addChart('doughnut', 'Data!A25:B29', rect, { title: 'Revenue by channel' }).